1. Implementing a perceptron learning algorithm in Python
Perceptron is on of the first algorithmically described machine learning algorithms for classification
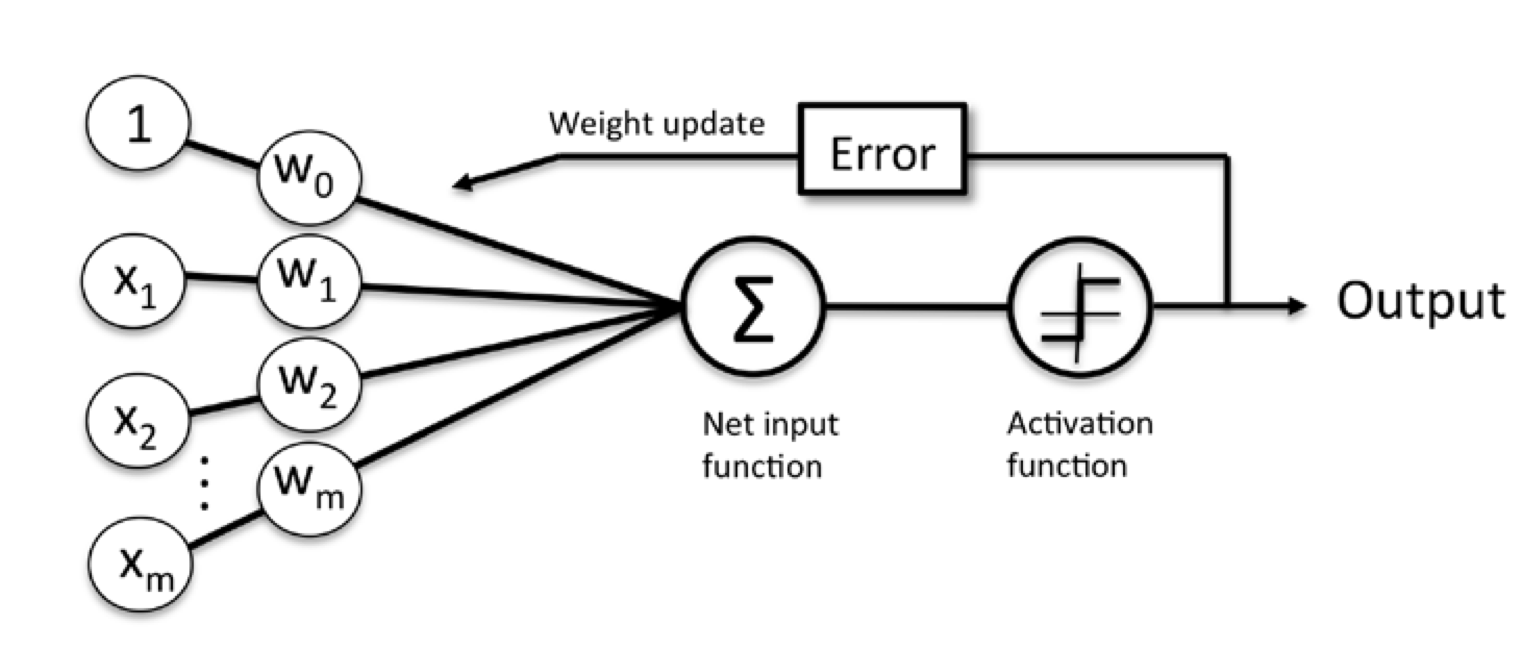
- Definition: perceptron is an algorithm for supervised learning of binary classifiers: a function that maps its input $x$ (a real-valued vector) to an output value (a single binary value) - activation function $\phi(z)$
- Equation:
$$w = \begin{bmatrix}
w_1
\vdots
w_m
\end{bmatrix}
, x = \begin{bmatrix}
x_1
\vdots
x_m
\end{bmatrix}
$$
$$
\phi(z) =
\begin{cases}
\text{1,} &\quad\text{if z } \geq \theta
\text{-1,} &\quad\text{otherwise}\
\end{cases}
$$
Bring the threshold $\theta$ to the left side of the equation and define a weight-zero: $w_0 = -\theta$ and $x_0 = 1$, we can write $z$ as follows:
and $$\phi(z) =
 \begin{cases}
   \text{1,} &\quad\text{if z } \geq \text{0}\\
   \text{-1,} &\quad\text{otherwise}\
 \end{cases} $$
Perceptron rule:
1. Initialize the weight to 0 or small random numbers
2. For each training sample $x^{(i)}$ perform the following steps:
- Compute the output values $\hat{y}$
- Update the weights
Weights are updated simultaneously follow below equation:
$\eta$ is the learning rate (a constant between 0.0 and 1.0), $y^{(i)}$ is the true class lable of the $i_{th}$ training sample, and $\hat{y_{(i)}}$ is the predicted class label.

Bellow is implemetation of the perceptron learning algorithm in Python
import numpy as np
class Perceptron(object):
    """Perceptron classifier

    Parameters
    -------------------
    eta : float
        Learnng reate (between 0.0 and 1.0)
    n_iter : int
        Passes over the training dataset.

    Attributes
    -------------------
    w_ : 1d-array
        Weights after fitting
    errors_ : list
        Number of misclassifications in every epoch.
    """

    def __init__(self, eta=0.01, n_iter=10):
        self.eta = eta
        self.n_iter = n_iter

    def fit(self, X, y):
        """Fit training data

        Parameters
        ---------------
        X : {array-like}, shape = [n_samples, n_features]
            Training vectors, where n_samples is the number of samples and n_features is number of features
        y : array-like, shape = [n_samples]
            Target values.

        Returns
        --------------
        self: Object

        """
        self.w_ = np.zeros(1 + X.shape[1])
        self.errors_ = []

        for _ in range(self.n_iter):
            errors = 0
            for xi, target in zip(X, y):
                update = self.eta * (target - self.predict(xi))
                self.w_[1:] += update * xi
                self.w_[0] += update
                errors += int(update != 0.0)
            self.errors_.append(errors)
        return self

    def net_input(self, X):
        """Calculate net input"""
        return np.dot(X, self.w_[1:]) + self.w_[0]

    def predict(self, X):
        return np.where(self.net_input(X) >= 0.0, 1, -1)
Training a perceptron model on the Iris dataset
import pandas as pd
df = pd.read_csv('https://archive.ics.uci.edu/ml/machine-learning-databases/iris/iris.data', header=None)
df.tail()
| 0 | 1 | 2 | 3 | 4 | |
|---|---|---|---|---|---|
| 145 | 6.7 | 3.0 | 5.2 | 2.3 | Iris-virginica |
| 146 | 6.3 | 2.5 | 5.0 | 1.9 | Iris-virginica |
| 147 | 6.5 | 3.0 | 5.2 | 2.0 | Iris-virginica |
| 148 | 6.2 | 3.4 | 5.4 | 2.3 | Iris-virginica |
| 149 | 5.9 | 3.0 | 5.1 | 1.8 | Iris-virginica |
%matplotlib inline
import matplotlib.pyplot as plt
import numpy as np
y = df.iloc[0:100, 4].values
y = np.where(y == 'Iris-setosa', -1, 1)
X = df.iloc[0:100, [0, 2]].values
plt.scatter(X[:50, 0], X[:50, 1], color='red', marker='o', label='setosa')
plt.scatter(X[50:100, 0], X[50:100, 1], color='blue', marker='x', label='versicolor')
plt.xlabel('petal length')
plt.ylabel('sepal length')
plt.legend(loc='upper left')
plt.show()

ppn = Perceptron(eta=0.1, n_iter=10)
ppn.fit(X, y)
<__main__.Perceptron at 0x117d84668>
plt.plot(range(1, len(ppn.errors_) + 1), ppn.errors_, marker='o')
plt.xlabel('Epochs')
plt.ylabel('Number of misclassifications')
plt.show()

Visualize the decision boundaries
from matplotlib.colors import ListedColormap

def plot_decision_regions(X, y, classifier, resolution=0.02):
    #setup marker generator and color map
    markers = ('s', 'x', 'o', '^', 'v')
    colors = ('red', 'blue', 'lightgreen', 'gray', 'cyan')
    cmap = ListedColormap(colors[:len(np.unique(y))])

    # plot the decision surface
    x1_min, x1_max = X[:, 0].min() -1, X[:, 0].max() + 1
    x2_min, x2_max = X[:, 1].min() -1, X[:, 1].max() + 1
    xx1, xx2 = np.meshgrid(np.arange(x1_min, x1_max, resolution), np.arange(x2_min, x2_max, resolution))
    Z = classifier.predict(np.array([xx1.ravel(), xx2.ravel()]).T)
    Z = Z.reshape(xx1.shape)
    plt.contour(xx1, xx2, Z, alpha=0.4, cmap=cmap)
    plt.xlim(xx1.min(), xx1.max())
    plt.ylim(xx2.min(), xx2.max())

    # plot class samples
    for idx, cl in enumerate(np.unique(y)):
        plt.scatter(x=X[y == cl, 0], y=X[y == cl, 1], alpha=0.8, c=cmap(idx), marker=markers[idx], label=cl)
plot_decision_regions(X, y, classifier=ppn)
plt.xlabel('sepal length [cm]')
plt.ylabel('petal length [cm]')
plt.legend(loc='upper left')
plt.show()

2. Adaptive Linear Neuron (Adaline)

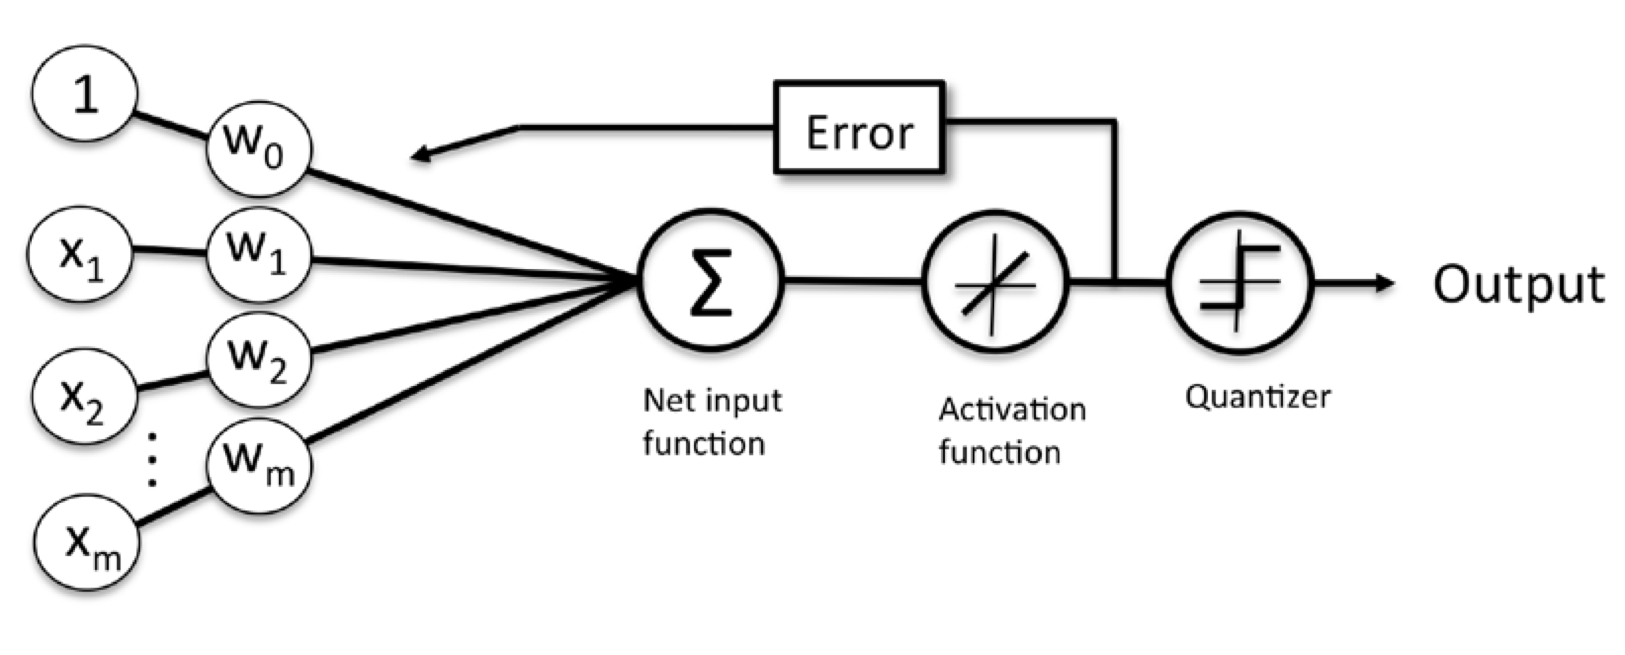
Minimizing cost functions with gradient descent
Cost function $J(w) = \frac{1}{2}\sum_i{(y^{(i)} - \phi(z^{(i)}))}^2$
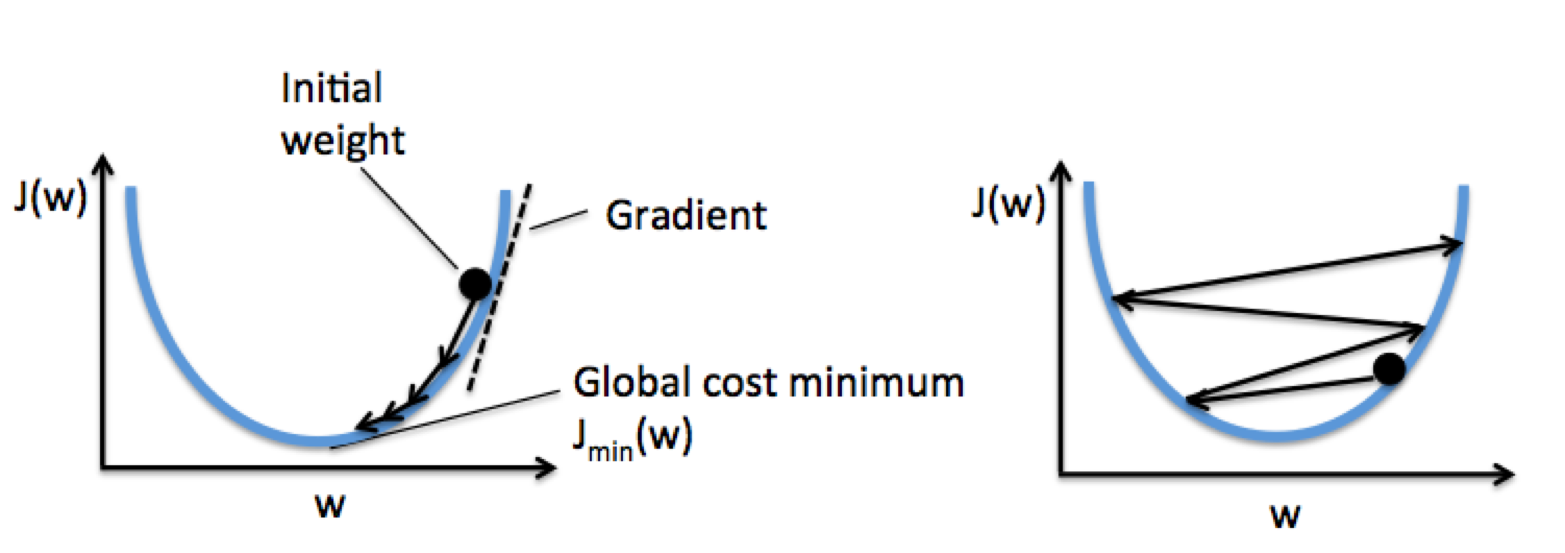
Using gradient descent, we can updae the weights by taking a step away from the gradient $\nabla J(w)$ of our cost functions $J(w)$
To compute the gradient of the cost function, we need to compute the partial derivative of the cost function with respect to each weight $w_j$: $\frac{\partial J}{\partial w_j} = - \sum_i{(y^{(i)} - \phi(z^{(i)}))}x_j^{(i)}$
Implementation of Adaptive Linear Neuron in Python
import numpy as np
class AdalineGD(object):
    """Adaptive Linear Neuron classifier

    Parameters
    -------------------
    eta : float
        Learnng reate (between 0.0 and 1.0)
    n_iter : int
        Passes over the training dataset.

    Attributes
    -------------------
    w_ : 1d-array
        Weights after fitting
    costs_ : list
        Number of misclassifications in every epoch.
    """

    def __init__(self, eta=0.01, n_iter=10):
        self.eta = eta
        self.n_iter = n_iter

    def fit(self, X, y):
        """Fit training data

        Parameters
        ---------------
        X : {array-like}, shape = [n_samples, n_features]
            Training vectors, where n_samples is the number of samples and n_features is number of features
        y : array-like, shape = [n_samples]
            Target values.

        Returns
        --------------
        self: Object

        """
        self.w_ = np.zeros(1 + X.shape[1])
        self.costs_ = []

        for i in range(self.n_iter):
            output = self.net_input(X)
            errors = (y - output)
            self.w_[1:] += self.eta * X.T.dot(errors)
            self.w_[0] += self.eta * errors.sum()
            cost = (errors**2).sum() / 2.0
            self.costs_.append(cost)
        return self

    def net_input(self, X):
        """Calculate net input"""
        return np.dot(X, self.w_[1:]) + self.w_[0]

    def activation(self, X):
        return self.net_input(X)

    def predict(self, X):
        return np.where(self.activation(X) >= 0.0, 1, -1)
Test the algorithm with different learning rate
fig, ax = plt.subplots(nrows=1, ncols=2, figsize=(8, 4))
ada1 = AdalineGD(n_iter=10, eta=0.01).fit(X, y)
ax[0].plot(range(1, len(ada1.costs_) + 1), np.log10(ada1.costs_), marker='o')
ax[0].set_xlabel('Epochs')
ax[0].set_ylabel('log(Sum-squared-error)')
ax[0].set_title('Adaline - Learning rate 0.01')
ada2 = AdalineGD(n_iter=10, eta=0.0001).fit(X, y)
ax[1].plot(range(1, len(ada2.costs_) + 1), ada2.costs_, marker='o')
ax[1].set_xlabel('Epochs')
ax[1].set_ylabel('Sum-squared-error')
ax[1].set_title('Adaline - Learning rate 0.0001')
plt.show()

Two problems of chossing learning rate too small or too large: if the learning rate is too small, the algorithm would require a very large number of epochs to converge. If the learning rate is too large, the algorithm may not converge (overshoot), the error becomes larger in every epoch (see following figures)
Feature scaling: stadardization
$\mu_i$ is mean of training sample, $\sigma_j$ is standard deviation
X_std = np.copy(X)
X_std[:,0] = (X[:,0] - X[:,0].mean()) / X[:, 0].std()
X_std[:,1] = (X[:,1] - X[:,1].mean()) / X[:, 1].std()
Train the Adaline again after standardization
ada = AdalineGD(n_iter=15, eta=0.01)
ada.fit(X_std, y)
<__main__.AdalineGD at 0x117fa5eb8>
plot_decision_regions(X_std, y, classifier=ada)
plt.title('Adaline - Gradient Descent')
plt.xlabel('sepal length [standardized]')
plt.ylabel('petal length [standardized]')
plt.legend(loc='upper left')
plt.show()
plt.plot(range(1, len(ada.costs_) + 1), ada.costs_, marker='o')
plt.xlabel('Epochs')
plt.ylabel('Sum-squared-error')
plt.show()


Large scale machine learning an stochastic gradient descent
For a very large dataset, batch gradient descent can be computationally quite costly, since we need to reevaluate the whole training dataset each time we take one step towards the global minimum.
A popular alternative is stochastic gradient descent. Instead of updating the weights based on the sum of the accumulated errors over all samples, we update the weights incrementally for each training sample:
import numpy as np
from numpy.random import seed
class AdalineSGD(object):
    """Adaptive Linear Neuron classifier

    Parameters
    -------------------
    eta : float
        Learnng reate (between 0.0 and 1.0)
    n_iter : int
        Passes over the training dataset.

    Attributes
    -------------------
    w_ : 1d-array
        Weights after fitting
    costs_ : list
        Number of misclassifications in every epoch.
    shuffle: bool
        Shuffles training data every epoch
    random_state: int
        Set random state for shuffling and initializing the weights
    """

    def __init__(self, eta=0.01, n_iter=10, shuffle=True, random_state=None):
        self.eta = eta
        self.n_iter = n_iter
        self.w_initialized = False
        self.shuffle = shuffle
        if random_state:
            seed(random_state)

    def fit(self, X, y):
        """Fit training data

        Parameters
        ---------------
        X : {array-like}, shape = [n_samples, n_features]
            Training vectors, where n_samples is the number of samples and n_features is number of features
        y : array-like, shape = [n_samples]
            Target values.

        Returns
        --------------
        self: Object

        """
        self._initialize_weights(X.shape[1])
        self.costs_ = []

        for i in range(self.n_iter):
            if self.shuffle:
                X, y = self._shuffle(X, y)
            cost = []
            for xi, target in zip(X, y):
                cost.append(self._update_weights(xi, target))
            avg_cost = sum(cost)/len(y)
            self.costs_.append(avg_cost)
        return self

    def partial_fit(self, X, y):
        """Fit training data without reinitializing the weights"""
        if not self.w_initialized:
            self._initialize_weights(X.shape[1])
        if y.ravel().shape[0] > 1:
            for xi, target in zip(X, y):
                self._update_weights(xi, target)
        else:
            self._update_weights(X, y)
        return self

    def _initialize_weights(self, m):
        self.w_ = np.zeros(1 + m)
        self.w_initialized = True

    def _shuffle(self, X, y):
        r = np.random.permutation(len(y))
        return X[r], y[r]

    def _update_weights(self, xi, target):
        output = self.net_input(xi)
        error = target - output
        self.w_[1:] += self.eta * xi.dot(error)
        self.w_[0] += self.eta * error
        cost = 0.5 * error**2
        return cost

    def net_input(self, X):
        """Calculate net input"""
        return np.dot(X, self.w_[1:]) + self.w_[0]

    def activation(self, X):
        return self.net_input(X)

    def predict(self, X):
        return np.where(self.activation(X) >= 0.0, 1, -1)
ada = AdalineSGD(n_iter=15, eta=0.01, random_state=1)
ada.fit(X_std, y)
<__main__.AdalineSGD at 0x1178a1438>
plot_decision_regions(X_std, y, classifier=ada)
plt.title('Adaline - Stochastic Gradient Descent')
plt.xlabel('sepal length [standardized]')
plt.ylabel('petal length [standardized]')
plt.legend(loc='upper left')
plt.show()
plt.plot(range(1, len(ada.costs_) + 1), ada.costs_, marker = 'o')
plt.xlabel('Epochs')
plt.ylabel('Average Cost')
plt.show()


ada.partial_fit(X_std[2,:], y[2])
<__main__.AdalineSGD at 0x1178a1438>
plot_decision_regions(X_std, y, classifier=ada)
plt.title('Adaline - Stochastic Gradient Descent')
plt.xlabel('sepal length [standardized]')
plt.ylabel('petal length [standardized]')
plt.legend(loc='upper left')
plt.show()
plt.plot(range(1, len(ada.costs_) + 1), ada.costs_, marker = 'o')
plt.xlabel('Epochs')
plt.ylabel('Average Cost')
plt.show()


